Imagine being drenched by a fire hose when you are trying to figure out which restaurant you should go out for dinner. That steady stream from the fire hose is in this case data coming from a multitude of foodie websites. That flow of data, Big Data, coming at you is useful if you can control it and ask the question you want to ask.

Big Data is a big deal. With so many streams of data coming at you from websites, sensors, mobile devices, etc. it is easy to be overwhelmed. With more than 500 million Tweets and 3.5 billion “Likes” a day, social media are examples of extremely large and noisy data streams. How can you manage data that is coming at you in so many different formats? And make an informed decision?
A key is the ability to capture the data, extract, transform, and load (ETL) it into a more standardized form (i.e. a database) that you can use in your computer. Once this fire hose of data is under control, what can you do with the data?
Enter Geographic Information Systems (GIS)
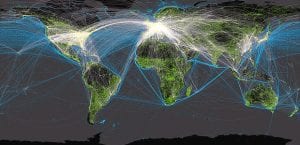
A picture is worth a thousand words. A GIS is a computerized map which you can overlay your Big Data, see patterns, ask queries, so you can make decisions. Visualizing your data on a map makes finding these patterns much easier than churning through pages of website reviews, tweets, streaming sensors, etc.
Big Data offers new data sources that have never been available before, and you can now make new kinds of maps, based on Big Data, plus data you collect using your GPS-enabled phone, free software and base maps.
Why Would I Want Big Data?
Big Data is typically captured and saved or streamed in real-time. With real-time data, you can ask questions and get answers to things happening now. A retailer could track a promotion by extracting all tweets and Instagram posts that hashtag their promotion. Plotting the locations of these tweets and posts can show patterns where most of your engaged customers are located, plus what they are saying about your product. Are they pleased with it, or not? If there are many poor reviews about your product or promotion in a particular city, or area within a city, you want to know and figure out why. With the GIS you could see which of your store branches is the closest to all the negative comments. Phone the store and try to find out what the issue is. Maybe a shipment to that store had many defective items? Make the fix, then watch the tweets and posts change on the GIS map.
In the end, Big Data by itself has no value; it’s meaningless. It’s what you do with the data that matters most. GIS can help you visualize that data and answers questions, better, faster, and with more confidence.
BCIT Can Help You Learn to Use Big Data with GIS
The BCIT GIS department now offers an online course, GIST 7160, GIS Databases & Big Data, which starts on April 10, 2017. You can sign up with Departmental approval if you do not have the course pre-requisites but have equivalent work experience. Limited spaces available so sign up quickly.
